


April Investment Memo
From $16 to $218

From $16 to $218
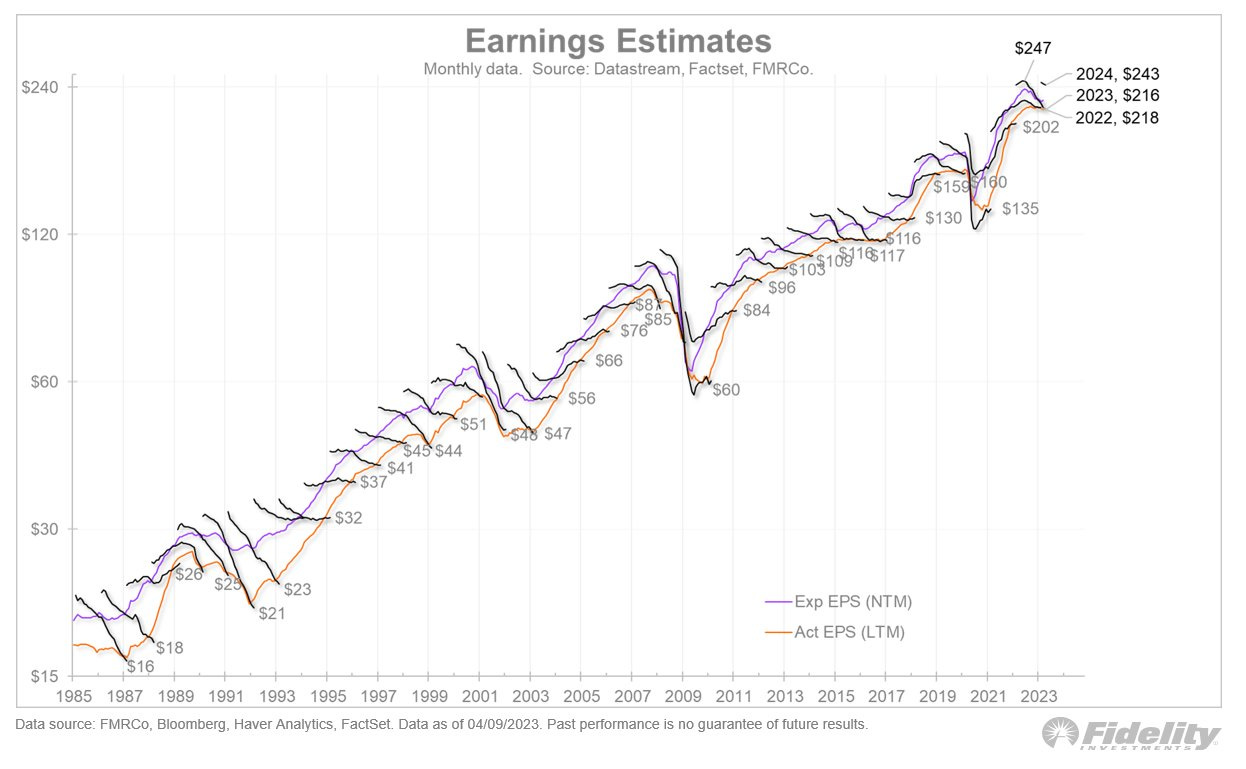
Sam Ro, one of my favorite investment writers, recently shared the below chart from Fidelity. The squiggly lines differentiate between analyst earning estimates and actual earnings per share.
(Source: @TimmerFidelity)
From Sam Ro’s Tker:
Based on current estimates, analysts expect EPS to decline modestly in 2023 while resuming growth at a healthy clip in 2024. Timmer says, “If the US economy is headed toward a recession later this year, those estimates are likely too optimistic.“
All this matters because earnings are the most important long-term driver of stock prices.
When you first look at the chart, it’s easy to get lost in the squiggly lines. But, my oh my, are analysts ever right?
Rarely. And though these are wickedly smart individuals working for well-resourced and connected firms, they are being asked to do an impossible job: predict the future1.
But this chart has another, more critical angle: $16 → $218.
Keep reading with a 7-day free trial
Subscribe to The Value of Advice to keep reading this post and get 7 days of free access to the full post archives.